20 Apr

Ratio analysis can provide insight into companies performance by comparing its performance and financial health over time. At the same time, it assesses how well a company performs in comparison to other companies in the same industry. Ratios are used by companies for comparisons. They evaluate stocks in a certain industry. They also compare a company’s present performance to its historical performance. In most cases, understanding the elements driving ratios is also crucial because management has the opportunity to change its strategy to make its stock and company ratios more appealing.
Outline
- What is ratio analysis?
- Types of ratio analysis
- What is the importance of ratio analysis?
- How ratio analysis is important in decision making?
What is ratio analysis?
The quantitative interpretation of a company’s financial performance is called ratio analysis. It is a key instrument that every company uses to determine financial liquidity, debt burden, profitability, and how effectively the firm operating in the market in comparison to its competitors.
Owners, consumers, managers, suppliers, vendors, lenders, regulators, and competitors all use financial ratio analysis to communicate an organization’s financial health and performance. This is accomplished by analyzing data contained in a company’s financial statements.
Types of ratio analysis
The many forms of financial ratios can be broadly categorized into the following five groups based on the data sets provide.
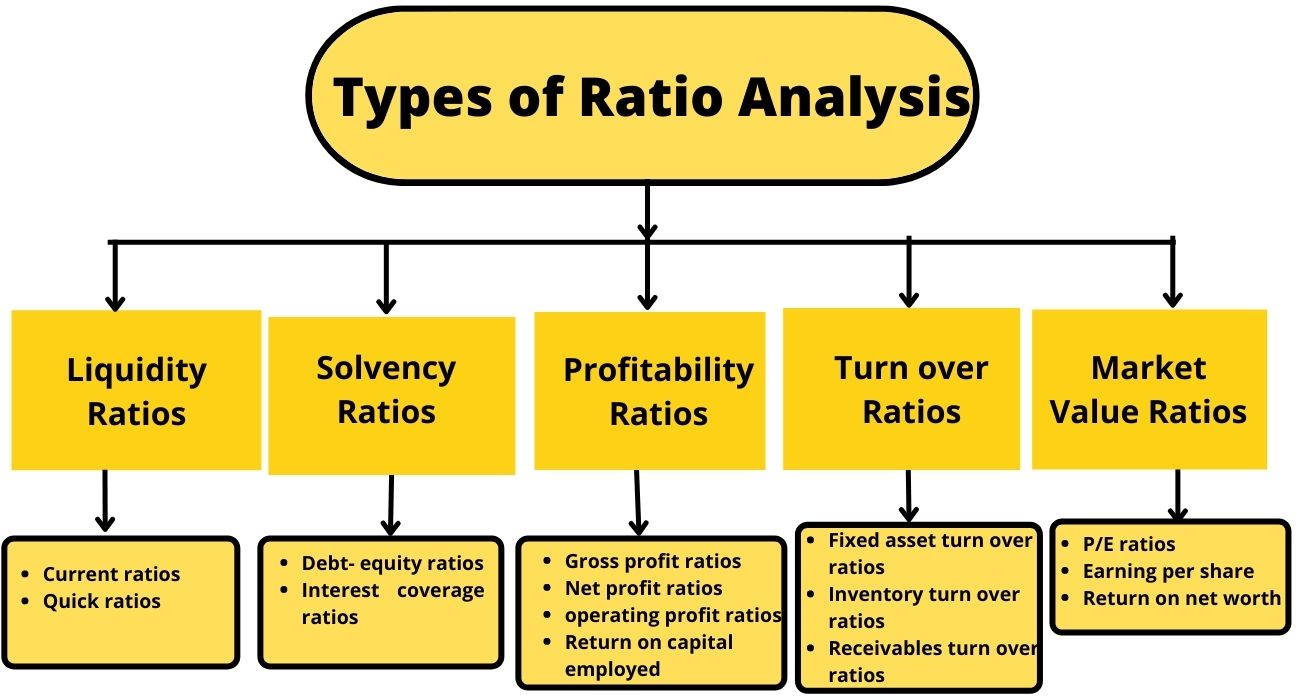
Liquidity Ratios
Liquidity ratios show how well a corporation can pay its short-term obligations. The higher this ratio, the better the company’s position is to repay its short-term loans. The two forms of liquidity ratios are the current ratio and the quick ratio.
Current ratios
Current ratios show the company’s ability to satisfy its obligations over the next 12 months. The greater the current ratio, the more potential the corporation is for meeting its current obligations. A very high current ratio, on the other hand, indicates that a lot of money is locked in receivables that may not be realized in the future.
Formula;

Quick ratios
Quick ratios show how many liquid assets(excluding inventory) the corporation has on hand to pay down its immediate liabilities. The quick ratio is regarded to be a more conservative metric than the current ratio because it considers all current assets and current liability coverage.
Formula;

Solvency ratios
Solvency ratios are also known as leverage ratios. These sorts of ratio analyses indicate whether the company is solvent and capable of repaying its lenders’ debts or not. it is one of the metrics used to determine whether a corporation will be able to stay solvent over time. As a measure of financial strength, a greater or strong solvency ratio is recommended.
The two forms of solvency ratios are debt-equity ratios and interest coverage ratios.
Debt-equity ratios
The D/E ratio depicts how debt is utilized to fund a business. The greater the debt-to-equity ratio, the more debt a company has and the greater the chance of default. In the event of a liquidation, the debt-to-equity ratio determines how much of the debt may be covered by the equity.
Formula;

Interest coverage ratios
The interest coverage ratio determines how much of a company’s available earnings can be used to meet current interest payments. It’s better to have a higher ratio. If the ratio goes below 1.5, it may indicate that a company will have difficulty meeting its obligations’ interest obligations.
Formula;

Where EBIT is earnings before income and tax.
Profitability Ratios
The profitability ratio indicates the Returns on Capital Invested generated by the business. Higher ratios are often more favorable, but when compared to similar companies’ results and the company’s own historical performance, these ratios provide much more information.
The most frequently used profitability ratios are;
Gross-profit ratios
The gross profit ratio determines how much profit a company makes as a percentage of total revenue. It calculates the difference between gross profit and sales revenue. A high gross profit ratio indicates that core activities are more efficient, allowing the company to meet operating expenses, fixed costs, dividends, and depreciation while still generating net earnings. A low gross profit ratio, on the other hand, shows a high cost of goods sold, which can be caused by poor purchasing policies, low selling prices, low sales, severe market competition, or ineffective sales promotion techniques.

Formula;
Net profit ratios
The net profit margin is a financial metric that measures how much profit a company makes as a percentage of total revenue. It gives a complete view of a company’s profitability after all expenses, such as interest expenses and taxes have been deducted. One of the drawbacks of these metrics is that it is more difficult to compare a firm’s performance to that of its competitors.
Formula;

Operating profit ratios
The Operating Profit Ratio is a metric that is used to evaluate the relationship between operating profit and net sales. This method helps the company by comparing its operating profit to the revenue it will generate.
Formula;

Return on capital employed
ROCE is a profitability statistic that shows how successfully a company can use its capital, including both debt and stock. When two companies have comparable revenues but different returns on capital employed, the company with the greater ratio is a superior investment for investors.
Formula;

Turn over ratios
The quantity of assets or liabilities which a company substitutes in relation to its sales is referred to as a turnover ratio. The turnover ratios show how effective or efficient a company’s management is. A greater asset turnover ratio is generally regarded as positive, as it indicates that receivables are recovered swiftly, fixed assets are intensively employed, and surplus inventory is kept to a minimum.
The forms of turnover ratios are noted below;
Fixed assets turnover ratios
This is a ratio that determines how much revenue is created by rotating the company’s fixed assets and how smoothly it is done. Because a company’s fixed assets are so important in generating income, optimizing the utilization of those assets can boost sales if done correctly.
Formula;

Inventory turnover ratios
The inventory turnover ratio calculates how much inventory must be kept on hand to support a certain level of sales. The type of operating process flow system utilized, the presence of old inventory, management’s strategy for satisfying, and the usage of manufacturing outsourcing, among other factors, can all have an impact.
Formula;

Receivables turnover ratios
The receivable turnover ratio is also known as the accounts receivables turnover ratio. It is a crucial financial number that shows a company’s capacity to collect its receivables. Accounts receivable collection is crucial for a company’s ability to meet its obligations on time.
Formula;

Market value ratios
The market value ratios are the financial measurements that are used to analyse the stocks’ worth of publicly traded corporations. These ratios can be used to determine if a stock is overvalued, undervalued, or priced in line with the market. These ratios aid in the decision-making process when it comes to investing in company stocks.
P/E ratios
Price-to-earning ratio is the most commonly used and significant ratio in this category. It determines if the stock is overvalued or undervalued in relation to its earnings potential. It is calculated by comparing the current share price to the per-share earnings reported by the company for the previous financial period.
Formula;

Earning per share
Earning per share ratio depicts the company’s earnings during the analysis period in relation to the number of outstanding shares at that time. This ratio aids in determining whether or not investing in it is worthwhile.
Formula;

Return on net worth
It reveals how much profit the company made with the capital it invested from both equity and preference shareholders.
Formula;

What is the importance of ratio analysis?
Analyzing performance: Ratio analysis is one of the most important methods for analyzing performance, identifying strengths and shortcomings, and highlighting areas for improvement.
You can get a bird’s eye view of how well your company is operating when compared to other participants in the industry by looking at vital financial details like current ratio, debt to equity, inventory turnover ratios, and so on.
Determining problems: Even if overall performance appears to be satisfactory, there are frequent problems that require management’s attention. Ratio analysis helps to identify those problems.
Financial Planning: Financial planning is done to help a company accomplish its strategic objectives. You try to measure your actual performance after you’ve met your goals. Ratio analysis is the most crucial method for analyzing performance, identifying strengths and shortcomings, and highlighting areas for improvement.
Help in forecasting: Pro forma financial statements, which provide predictions of financial statement items for one or more future periods, can be prepared using ratio analysis. Ratio analysis and forecasting assist management in developing plans and investors in assessing the company’s progress.
Assess efficiency: It gives a wide picture of the company’s health, financial stability, and market value. Profitability and solvency ratios are used to evaluate a company’s overall performance.
Comparing performance: One of the most important benefits of ratio analysis is that it makes it easier to compare two firms. It also aids in determining if the company is overvalued or undervalued in comparison to its peers.
Analyzing past results: Another benefit of ratio analysis is that it aids in comprehending the many relationships and interconnections in previous data as well as analyzing the outcomes.
How ratio analysis is important in decision making?
Financial ratio analysis provides essential information to managers who must make decisions for the company and also the external parties such as investors who need to assess the company’s financial health and the competitors.
Financial managers: Ratio analysis is a powerful and useful tool for financial analysis. They require the data that financial ratio analysis provides on the performance of the business’s many financial operations.
Analysts: Analysts are primarily responsible for crunching the numbers in the company’s data. In cases where a company’s performance is declining, ratios provide an early warning. Ratio analysis is used by analysts to assess how well a company manages its inventories.
Investors: Potential investors require financial information derived via ratio analysis to decide whether or not they want to invest in a publicly-traded company or one financed by venture capital.
Competitors: Other businesses consider information about their industry’s competitors to be crucial to their own competitive strategy and to make many important decisions.
The bottom line
Ratio analysis is a quantitative evaluation of a company’s financial performance. Ratio analysis is used by investors and analysts to assess a company’s financial health by examining past and current financial statements. Comparative data can be used to show how a company performs over time and to forecast anticipated future performance. This data is also used to compare a company’s financial status to industry averages and to assess how it stacks up against its competitors.
Content writer at Invyce.com


Meena Khan