14 Jun

Comparative financial statements present financial information for two or more reporting periods. This can help analyze the company’s financial health and understand how healthy your business is. If you’re starting as an accountant, it’s helpful to understand how to read comparative statements so you can tell what has changed over time and why these changes may have occurred.
What are Comparative Financial Statements?
Comparative financial statements are accounting reports that compare the financial performance of two or more different periods. Typically, comparative financial statements will have two columns of data: the first column includes the most recent year’s financial results, and the second column includes the previous year’s financial results. Some companies also choose to include a third column with data from one or more years prior to the previous year. They make it easy to see how your business has changed over time, which is essential to understanding your progress (or lack thereof) and making changes where needed.
For example, let’s say you have a small bakery that sells cakes, pastries, and other sweets to customers in your town. You want to analyze whether your store can stay operational another year. If you used comparative statements from previous years and this year’s statements, you could see if expenses were higher last year. Because of an increase in sales or if costs are going up due to inflation.
Types of Financial Comparative Statements
There are three types of comparative financial statements;
Comparative balance sheet describes the company’s financial position at the end of the accounting period day for multiple periods.
Comparative income statement shows the company’s operating and net income status over multiple accounting years.
Comparative cash flow statement depicts cash movement and its sources, such as operating, investing, and financial activities, over multiple accounting periods.
Generally, the companies provide only the Income Statements and Balance Sheets. This article will discuss these two comparative financial statements in detail.
Comparative Balance Sheet
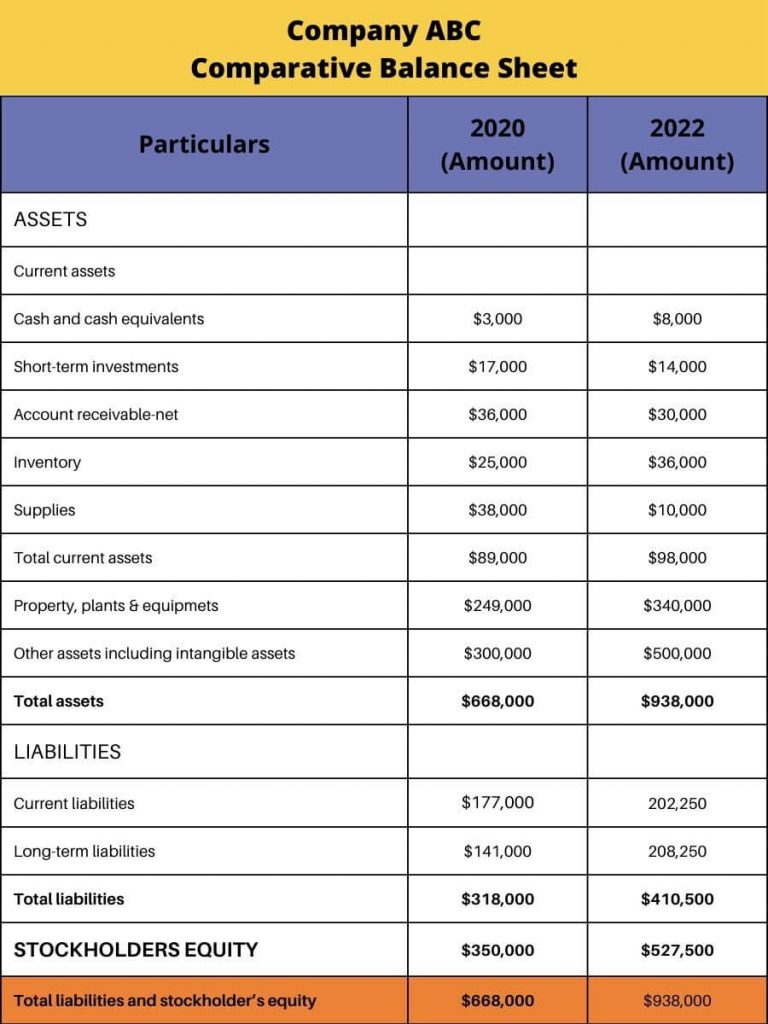
A comparative balance sheet is a side-by-side comparison of a current and previous accounting period’s balance sheet report of the same company. The comparative figures in comparative balance sheets can assist you in identifying trends and areas of strength and weakness. It can also help you understand seasonal fluctuations so you can make better business decisions.
For example, the comparative balance sheet of company ABC for the years 2020 and 2021 is given below.

Percentage change formula can be use to figure out the increase or decrease in assets or liabilities. For example, for the company ABC, the balance sheet shows that for the year 2020, the amount of assets was $668,000, while for the year 2021, the amount is $938,000. As you can see from the figure, the absolute change in assets is $270,000. However, we will use the percentage change formula to find out the percentage increase.
Percentage change formula = (absolute figures of current period – absolute figures of previous period) ÷ (absolute figures of previous period) х 100
= ($938,000 – $668,000) ÷ ($668,000) х 100
Percentage change formula = 40%
This shows that company ABC had a 40% increase in assets in the current year(2021) compared to the previous year (2020).
Comparative Income Statement
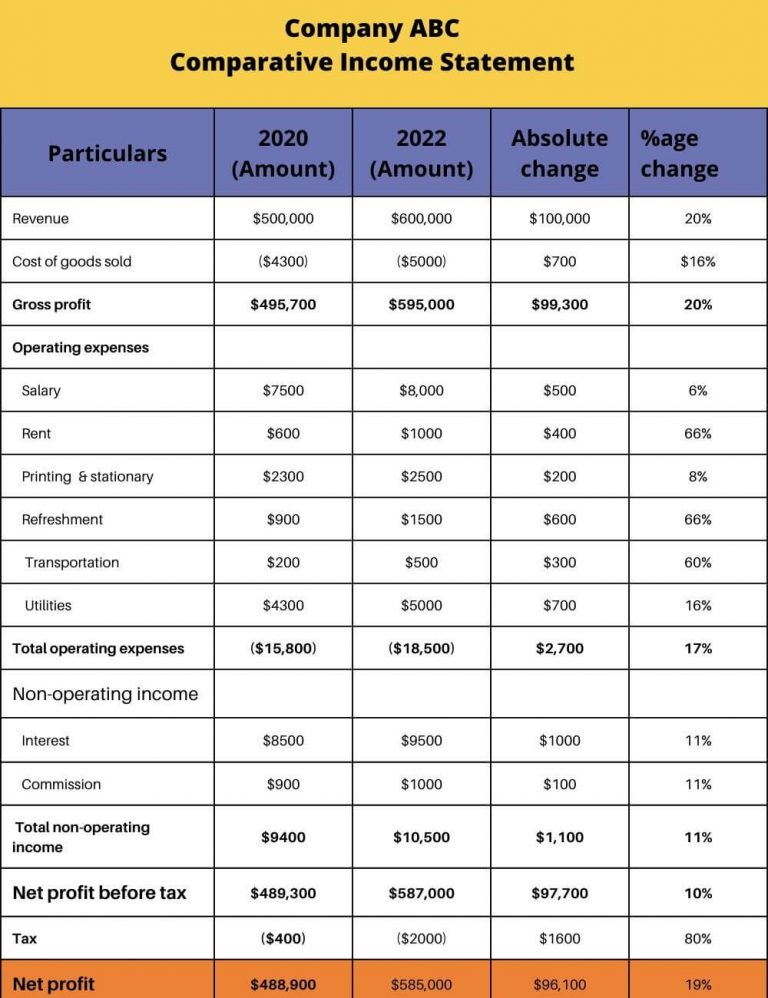
A comparative income statement summarises the company’s operational results over multiple accounting periods. It enables the business owner to compare the outcomes of business operations over time.
It shows how the business has progressed over a few years. This statement also aids in determining the changes that occur in each income statement line item over time.

Based on the above Comparative Income Statement of company ABC, it can be analyzed that there is a 20% increase in sales over the previous year. You can also observe that sales have impacted the Net profit, which increased by 19% from a year earlier. Moreover, you can also see how various line items have contributed to an increase in net profit.
Benefits of Comparative Financial Statements
Comparative financial statements are an important tool for analyzing a business’s finances. For example, they can be used to compare the current year to the previous year or other years. It helps you to see how a company is doing and whether it needs improvement.
It also shows you how much each line item changed compared to the previous years. It helps you pinpoint where your progress comes from or whether any huge mistakes were made in the past that need fixing.
Investors can use this information to compare their financials with those of similar companies in their industry as well as benchmark them against other sectors altogether. It’s a great way of seeing how well or poorly your company stacks up against its competitors. If there are areas where you feel improvements could be made, then now would be an excellent time to start making them!
Conclusion
A comparative financial statement is a format of the balance sheet, income statement, and cash flow statement that compares the company’s financial performance over time. This allows you to see how your business has grown or changed over the course of its life.
Content writer at Invyce.com
Related Post
Copyright © 2024 – Powered by uConnect


Meena Khan