28 Apr

By examining financial statements including the balance sheet and income statement, ratio analysis is a quantitative approach to acquiring insight into a company’s liquidity, operational efficiency, and profitability. Fundamental equity analysis relies heavily on ratio analysis. Calculations and interpretations of ratio analysis are vital instruments that every company uses to determine financial liquidity, debt burden, profitability, and how effectively the firm is located in the market compared to its rivals.
Types of ratio analysis:
- Current ratios
- Quick ratios
- Debt equity ratios
- Interest coverage ratios
- Gross profit ratios
- Net profit ratios
- Operating profit ratios
- Return on capital employed
- Fixed assets turnover ratios
- Inventory turnover ratios
- Receivables turnover ratios
- P/E ratios
- Earning per share
- Return on net worth
Current Ratio
The Current ratio refers to the current asset-to-current-liability ratio. This ratio assesses a company’s capacity to meet its existing liabilities with current assets. A high current ratio is a positive indicator for a corporation. Creditors are more ready to give credit to people who can demonstrate that they have the financial means to pay back their debts.
Formula to find current ratio

Calculations
To find the current ratio let’s consider below balance sheet of the company ABC;
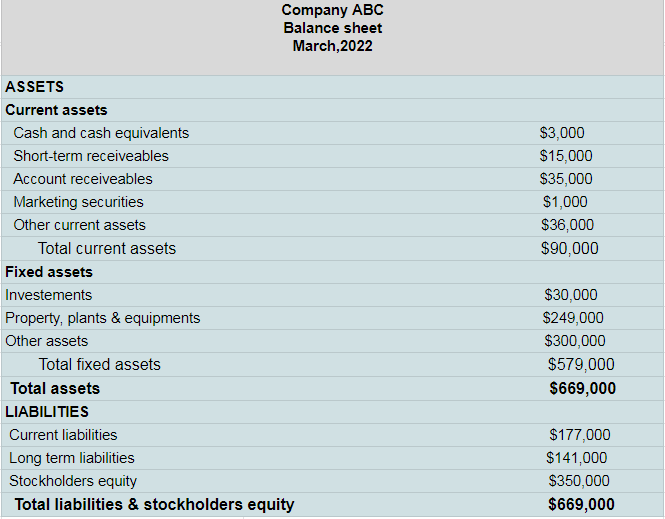
To find out the current ratio, we need to know the values of current assets and current liabilities. From the above-given balance sheet of company ABC, the values are;
| Current assets | $90,000 |
| Current liabilities | $177,000 |
Current ratio= 90,000 ÷ 177,000
Current ratio= 0.5
Interpretation
The current ratio ranging from 1.5 to 3 is considered healthy in general. Liquidity concerns are typically indicated by ratios less than one, while working capital management issues are characterized by ratios more than three. A corporation with a current ratio of less than one has insufficient current assets to meet its current financial obligations.
For example, the current ratio for ABC company is 0.5, which indicates liquidity problems. For every $1 of current liability, the company has $0.5 of current assets available to pay for it.
Quick Ratio
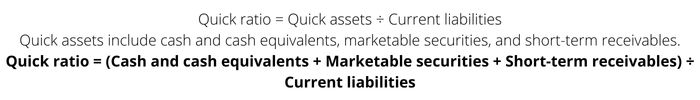
The quick ratio or the acid-test ratio, is a financial ratio that assesses liquidity by examining current, more liquid assets. It is calculated similarly to the current ratio, except that inventory and prepayments are not included.
The formula for quick ratio
Calculations
From the balance sheet of the company ABC, the required values to find a quick ratio are as follows;
| Cash and cash equivalents | $3,000 |
| Marketable securities | $1,000 |
| Short-term receivables | $35,000 |
| Current liabilities | $177,000 |
Quick ratio= (3,000+1000+35,000) ÷ 177,000
Quick ratio= 39,000÷177,000
Quick ratio= 0.22
Interpretation
A quick ratio larger than one indicates that the company has sufficient short-term assets to cover its current liabilities. Quick assets are short-term assets that can quickly be converted to cash. As a result, creditors prefer organizations with high quick ratios.
The quick ratio for company ABC is 0.22, which indicates that the company does not have sufficient assets to cover liabilities. In other words, for every $1 of current liability, the company has $0.22 of quick assets to pay for it.
Debt to Equity Ratio
The debt-to-equity ratio (also known as the debt-equity ratio) is a long-term solvency statistic that assesses a company’s long-term financial practices. The debt-to-equity ratio shows the company’s funding originates from creditors and investors.
The formula for debt-equity ratio

Calculations
| Total liabilities | $318,000 |
| Stockholders equity | $350,000 |
Debt to equity ratio= 318,000 ÷ 350,000
Debt to ratio= 0.90
Interpretation
A ratio of 1 indicates that creditors and investors share equally in the company’s assets. A ratio of that is less than one means that the portion of assets supplied by stockholders is larger than the portion provided by creditors. Conversely, a ratio of more than one means that the portion of assets provided by creditors is greater than that of stockholders.
ABC Company’s debt-to-equity ratio is 0.90, or 0.90:1. It signifies that the liabilities are 90 percent of the stockholders’ equity or that creditors provide 90 cents for every dollar that stockholders provide to fund the assets. Creditors prefer a low debt to equity ratio because a low ratio (less than 1) indicates that their money is better protected.
Interest Coverage Ratio
The Interest Coverage Statistic (ICR) is a financial ratio used to assess a company’s ability to pay interest on its existing obligation. Creditors and investors use this calculation to determine a company’s profitability and risks.
The formula for interest coverage ratio

Calculations
Company ABC is a business that makes cookies and ships them across the city. The company owners want to expand their business, but they don’t have the funds to purchase more machines. Thus, they go to several banks with their financial statements to get the funding. The company’s earnings before interest and taxes are $47,000, and interest and taxes are $8,500 and $5,000, respectively.
| EBIT | $47,000 |
| Interest expenses | $8,500 |
The bank would compute the interest coverage ratio like this:
Interest coverage ratio= 47,000 ÷ 8,500
Interest coverage ratio= 5.52
Interpretation
A corporation with a ratio of less than 1 will be unable to pay its debt interest. This type of business is extremely dangerous and would almost certainly never be approved for bank financing. If the coverage equation equals 1, the corporation only produces enough money to cover its interest payments. Suppose the coverage ratio is more than one. In that case, the corporation makes enough money to satisfy its interest commitments while still having enough money left over to pay the principal. Banks want to ensure that a company’s current interest payments are at least 1.5 times its current interest payments.
In the above example, the company has a ratio of 5.52. This means that the company makes 5.52 times more earnings than current interest payments. Therefore, they can well afford to pay the interest on existing debt and its principal payments. This ratio is a good sign as it shows that company risk is low and operations produce enough cash to pay bills.
Gross Profit Margin
A company’s gross profit margin, often known as gross margin, measures its profitability. The gross profit margin is the revenue left over after a corporation has paid for labor and materials in a specific accounting period. Gross profit is the total amount of money left over after subtracting the cost of goods sold from net sales (cost of sales)
The formula for gross profit ratio

Calculations
For example, let’s assume that a leather jacket maker might sell one jacket for $100. They spent $60 to buy raw materials and paid for labor.
| Net sale | $100 |
| Cost of the goods sale | $60 |
Gross profit= $100 – $60
Gross profit = 40
Gross profit margin = (40 ÷100) x 100
Gross profit margin = 40%
Interpretation
A large gross profit margin implies that you are profiting from a product, whereas a low margin suggests that your sale price is not much greater than the cost. For the above example, a leather jacket firm with a gross profit margin of 40% is regarded as financially sound, though it’s worth remembering that each industry has its definition of what constitutes a positive gross profit margin.
Net Profit Margin
The net profit margin (sometimes called “return on sales”) is the ratio of net profit to net sales. The income statement’s bottom line is the net measure of how much net income or profit is generated as a percentage of revenue. It is the money left over after which, expenses and losses have been paid. Net profit margin measures how much net income or profit is generated as a percentage of revenue.
The formula for net profit margin

Calculations
For example, company ABC has a net profit of $68,00 in its most recent month of operations however, during that time, it had sales of $15,000.
| Net profit | $68,00 |
| Net sales | $15,000 |
Thus, its net profit margin is:
Net profit margin= ( 68,00 ÷ 15,000) x 100
Net profit margin = 45.3%
Interpretation
A net profit margin of more than 10% is significant, though this varies by industry and corporate structure. For example, the net profit margin for company ABC is 45.3% which means that it is efficient at running its operations and turning revenue into net income.
Operating Profit Margin
The operating margin of a company, also known as return on sales (ROS), is a strong indicator of how effectively it is managed and efficient at creating profits from sales. Investors and lenders pay special attention because it reveals the proportion of revenues available to cover non-operating costs such as paying interest.
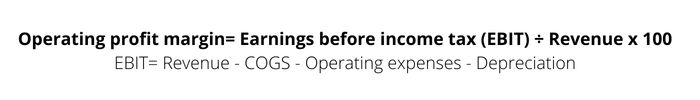
The formula for operating profit margin
Calculations
Let’s say that the company ABC’s income statement shows the following values;
| Revenue | $300,000 |
| Cost of goods sold (COGS) | $60,000 |
| Operating expenses | $10,000 |
| Depreciation | $30,000 |
EBIT = $300,000- $60,000- $10,000- $30,000
EBIT= $200,000
Operating profit margin= $200,000 ÷ $300,000 х 100
Operating profit margin= 66%
Interpretation
High operating margins compared to the industry average, or margins rising upward over time, show management’s efficiency in growing operational profits. Low operating margins and deteriorating margins, on the other hand, could indicate underlying problems in the company’s future trajectory, such as inadequate growth strategies and wasteful capital allocation.
The operating profit ratio for ABC company is 66%, indicating that the company has better management and uses its resources efficiently.
Return on Capital Employed
Return on capital employed also known as ROCE is a profitability statistic that compares net operating profit to capital employed to determine how efficiently a company can create profits from its capital employed. Investors use ROCE values to determine whether or not they will see a profit on their investment in a company. You may better position your firm for investment or learn how to invest in a business by knowing ROCE.
The formula for return on capital employed
Return on capital employed = EBIT ÷ Capital employed
EBIT= Revenue – COGS – Operating expenses
Capital employed = Total assets – Total liabilities
Calculations
To calculate the return on capital employed, let’s consider the following values of revenue, COGS, and operating expenses from the income statement and values of total assets and total liabilities from the balance sheet;
| Revenue | $300,000 |
| COGS | $70,000 |
| Operating expenses | $60,000 |
| Total assets | $669,000 |
| Total liabilities | $177,000 |
First,find the value of EBIT;
EBIT= $300,000 – $70,000 – $60,000
EBIT = $170,000
Then, find out the value of capital employed;
Capital employed= $669,000 – $177,000
Capital employed = $492,000
Finally, put the values of EBIT and capital employed to find return on capital employed;
Return on capital employed = $170,000 ÷ $492,000
Return on capital employed = 0.34 =34%
Interpretation
A higher ROCE is usually preferable because more earnings are earned per dollar of invested capital. In the above example ROCE of 34% means that for every dollar invested in capital, the company generated 34 cents in operating income.
Fixed Assets Turnover Ratio
The fixed asset turnover ratio formula assesses a firm’s ability to generate revenue from its fixed assets. This ratio measures how well a corporation generates revenue from its existing fixed assets.
The formula for fixed assets turnover ratio

Calculations
Suppose the values of gross sales, sales returns, fixed assets, and accumulated depreciation of company ABC are as follows;
| Gross sales | $200,000 |
| Sales returns | $15,000 |
| Fixed assets | $85,000 |
| Accumulated depreciation | $70,000 |
Net Revenue or net sales = $200,000 – $15,000
Net revenue= $185,000
Net Fixed Assets = $85,000 – $70,000
Net fixed assets= $15,000
Fixed assets turnover ratio= $185,000 ÷ $15,000
Net fixed assets turnover ratio= 12.3
Interpretation
Although a higher turnover ratio indicates greater efficiency in managing fixed-asset investments, there is no exact number or range that determines whether a company is effective at generating revenue from such investments. Generally, the greater the fixed asset turnover ratio, the better because the company is earning more income per dollar of long-term assets possessed. When a corporation’s fixed asset turnover is high, it means the company is effectively purchasing long-term assets. On the other hand, if a firm’s fixed asset turnover is low, it means the company isn’t getting enough value (i.e., revenue) from its long-term assets.
Inventory turnover ratio
The time it takes for an item to be purchased by a corporation to be sold is referred to as inventory turnover. A complete inventory turnover indicates the company sold all of the stock it bought, minus any items lost due to damage or shrinking.
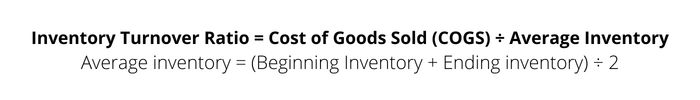
The formula for fixed assets turnover ratio
Calculations
Company ABC is a company that sells leather jackets. For the year 2022, the cost of goods sold on the income statement is reported to be $70,000. The company’s beginning Inventory was $40,000, and the ending inventory was $30,000.
| Cost of goods sold | $70,000 |
| Beginning inventory | $40,000 |
| Ending inventory | $30,000 |
Average inventory= ($40,000+$30,000) ÷ 2
Average inventory= $55,000
Inventory turnover ratio= $70,000 ÷ $55,000
Inventory turnover ratio= 1.27
Interpretation
The ideal inventory turnover ratio is between 2 and 6. If the value of your inventory turnover ratio is in this range, it means your restocking and sales rates are in harmony. To fulfill demand, you’ll have just the correct amount of inventory. The inventory turnover ratio for the above example is 1.27, which is below two. This value suggests weak sales and declining product demand. This could lead to an overabundance of inventory on warehouse shelves, as well as a waste of space and resources.
Receivables turnover ratios
The receivables turnover ratio assesses how efficiently a company can collect its receivables or offer credit to its clients. The ratio also determines how many times a company’s receivables are turned into cash during a given time period. On an annual, quarterly, or monthly basis, the receivables turnover ratio is determined.
The formula for receivables turnover ratio

Calculations
For example, the company named “Party Planners” sells floral arrangements for events and parties. The net credit sale of the company is $100,000. Starting accounts receivables for the year 2022 were $10,000. Ending accounts receivables for the year were $15,000. The formula for calculating how many times in that year the company collected their average accounts receivables looks like this:
| Net credit sale | $100,000 |
| Starting accounts receivables | $10,000 |
| Ending accounts receivables | $15,000 |
Average receivables = $10,000 + $15,000 ÷ 2
Average receivables = $17,500
Receivables turnover ratio= $100,000 ÷ $17,000
Receivables turnover ratio = 5.88
Interpretation
In general, the higher an organization’s accounts receivable turnover ratio is, the more efficient it is at collecting cash payments for credit sales. If the company’s accounts receivable turnover is low, the collection operations will most likely need to be tweaked to address late payment difficulties. Inefficient collection procedures, such as tax credit standards and the absence of severe creditworthiness evaluations, contribute to low A/R turnover.
P/E ratios
The price-to-earnings ratio of a firm is a method of determining whether the stock price is high or low in comparison to the past or to other companies. Divide the current stock price by the current earnings per share to get the ratio. Earnings-per-share is calculated by dividing the previous year’s earnings by the number of outstanding common shares.
The formula P/E ratio

Calculations
For example, at the end of the year 2021, company ABC closed the year showing the following:
| Earning per share | $5 |
| Market value per share | $25 |
P/E ratio= $25 ÷ $5
P/E ratio= 5
Interpretation
In general, a high P/E ratio indicates that investors expect stronger future growth. The market P/E ratio is typically 20-25 times earnings. The predicted P/E ratio can be calculated using estimated earnings. A P/E ratio is not used by companies that are losing money.
The company ABC in the above example, was valued at about five times its earnings. However, until it is compared to anything else, the 5 P/E is not a useful metric. The stock’s industry group, a benchmark index, or the stock’s historical P/E range are all popular comparisons.
Earning per share
Earnings per share, or EPS, is a key financial metric that measures a company’s profitability. It’s computed by multiplying the company’s net income by the total number of shares outstanding. It’s a common measure used by market players to assess a company’s profitability before investing in its stock.
The formula for ESP

Calculations
As an example, suppose that for the year 2022 net income for company ABC was $690,000. Its preferred stock dividends were $48,000, and Its average outstanding common shares stood at $200,00.
| Net income | $69,000 |
| Preferred dividends | $48,000 |
| Average outstanding common shares | $20,000 |
EPS= ($69,000 – $48,000) ÷ $20,000
EPS= 1.05
Interpretation
Higher earnings per share ratio are usually preferable to a lower ratio since it indicates that the company is prosperous and has more profits to deliver to its shareholders. Quality’s EPS for the year 2022 0f company ABC is $1.05. This means that if Quality distributed every dollar of income to its shareholders, each share would receive 1.05 dollars.
Return on net worth
The return on net assets (RONA) metric compares net profits to net assets to determine how effectively a company can benefit from its asset base. It can also be used to compare a company’s performance to its peers. A high asset-to-profit ratio indicates that management is doing a good job.
The formula for return on net worth

Calculations
For example, let’s assume that company ABC posted a net profit of $180,000 in the past year. At the same time, the value of shareholders’ equity was $200,000;
| Net profit | $180,000 |
| Shareholders equity | $200,000 |
The RONW will be,
Return on net worth = $180,000 ÷ $200,000
RONW = 0.9
Interpretation
A rising RoNW indicates that a business is improving its ability to create profit while using less capital. It also refers to how effectively a company’s management is utilizing its owners’ capital. In other words, the better the company prospectus, the greater the RoNW. Conversely, falling RoNW is a common issue.
Conclusion
The forms of ratios analysis listed above are some of the types that a company might employ for its ratio analysis. Ratio analysis calculations and their interpretations are an essential tool for any type of strategic business planning by the company’s top management.
Content writer at Invyce.com


Meena Khan